How To Debug Angular In Visual Studio Code?
Hey there! Are you wondering how to debug Angular in Visual Studio Code? Don’t worry, I’ve got you covered!
Debugging Angular applications is an essential skill for every developer. With Visual Studio Code, one of the most popular code editors out there, you can streamline your debugging process and make your coding life a lot easier.
In this article, I’m going to show you step-by-step how to debug your Angular projects in Visual Studio Code, so you can squash those bugs and get your code running smoothly in no time! Let’s dive in!
- Install the Angular Language Service extension in Visual Studio Code.
- Open the Angular project folder in Visual Studio Code.
- Set breakpoints in your code to pause execution.
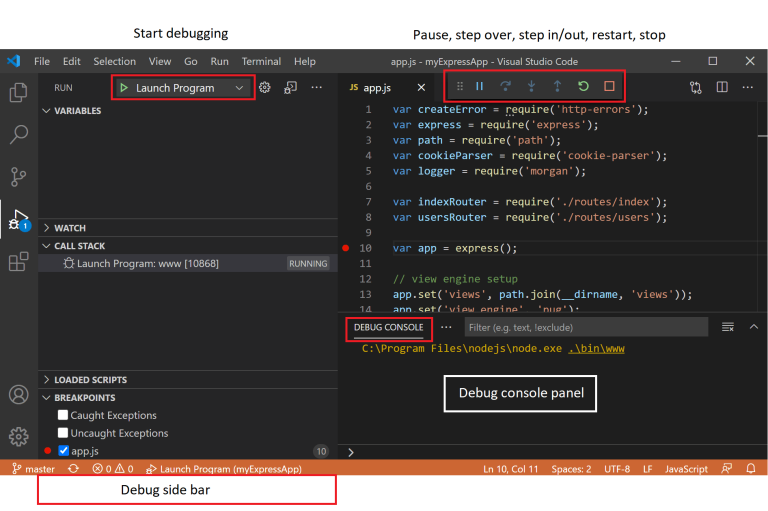
- Launch the debugger by clicking on the “Run and Debug” button.
- Use the debug toolbar to step through your code, inspect variables, and resolve issues.

How to Debug Angular in Visual Studio Code?
Debugging Angular applications in Visual Studio Code can greatly enhance your development process by helping you identify and fix issues more efficiently. In this article, we will explore various techniques and tools available in Visual Studio Code that can assist you in debugging your Angular projects.
1. Setting Up Debugging Configuration
Before you can start debugging your Angular project in Visual Studio Code, you need to set up the debugging configuration. This configuration tells the debugger how to launch and attach to your Angular application. To configure the debugger, you can create a launch.json file in your project’s .vscode folder. This file contains the necessary settings to start the debugger.
Within the launch.json file, you can define different configurations for running and debugging your Angular application. For example, you can specify the launch type (e.g., Chrome or Edge), the URL of your application, and additional arguments or environment variables. Once you have set up the configuration, you can easily start debugging by selecting the desired configuration in Visual Studio Code’s debugger panel and clicking the “Start Debugging” button.
Using the debugging configuration, you can set breakpoints in your code, step through the execution, inspect variables, and analyze the call stack, allowing you to identify and resolve issues in your Angular application.
2. Remote Debugging with Chrome DevTools
In addition to the built-in debugger in Visual Studio Code, you can also leverage the power of Chrome DevTools for advanced debugging techniques. With remote debugging, you can connect Visual Studio Code to an instance of Google Chrome running your Angular application. This allows you to debug issues that only occur in specific browsers or test your application in different environments.
To start remote debugging, you need to launch your Angular application with the –remote-debugging-port flag using the ng serve command. This will enable the Chrome DevTools Protocol, which will expose a debugging port. Then, open Chrome and navigate to the URL output by the ng serve command, followed by /json. This will display a JSON array containing numerous browser tabs and debugging targets.
In Visual Studio Code, you can use the “Chrome Debug” extension to connect to one of the debugging targets provided by the JSON array. After launching the extension, you can select the desired target and start debugging your Angular application using Chrome DevTools directly within Visual Studio Code. This gives you access to powerful features such as network tracing, performance analysis, and live editing of your code while debugging.
3. Logging and Console Output
Another useful technique for debugging Angular applications is logging and console output. By strategically placing console.log statements in your code, you can track variable values, function calls, and program flow. This can be especially helpful when investigating issues related to data manipulation, conditional statements, or event handling.
Visual Studio Code provides a built-in terminal that displays the console output from your Angular application. You can open the terminal by navigating to the “View” menu, selecting “Terminal,” and choosing “New Terminal.” From this terminal, you can run your Angular application using the ng serve command, and any console.log statements in your code will be displayed in real-time. By inspecting the output, you can analyze the state of your application and identify any unexpected behavior or errors.
In addition to console.log, you can also utilize the Angular logging mechanisms, such as the Angular Logger service or the Angular Error Handler, to capture and log specific events, warnings, or errors. This can provide more detailed information and help you pinpoint the exact location of issues in your Angular codebase.
4. Utilizing Breakpoints and Watch Expressions
Breakpoints and watch expressions are powerful debugging tools that allow you to pause the execution of your Angular application at specific points and inspect the state of variables and expressions. By setting breakpoints at critical sections of your code, you can analyze the behavior and values of variables, step through the code line by line, and uncover the root cause of bugs.
In Visual Studio Code, you can set breakpoints by clicking on the gutter area next to the line numbers in your editor. Once a breakpoint is set, the execution of your Angular application will pause when it reaches that line, and you can examine the state of your variables using the built-in debugger interface. You can hover over variables to see their current values, modify them to test different scenarios, and use watch expressions to evaluate complex expressions and monitor their changes during runtime.
Using breakpoints and watch expressions in combination with the other debugging techniques mentioned earlier can greatly accelerate your troubleshooting process and help you resolve issues more efficiently in your Angular projects.
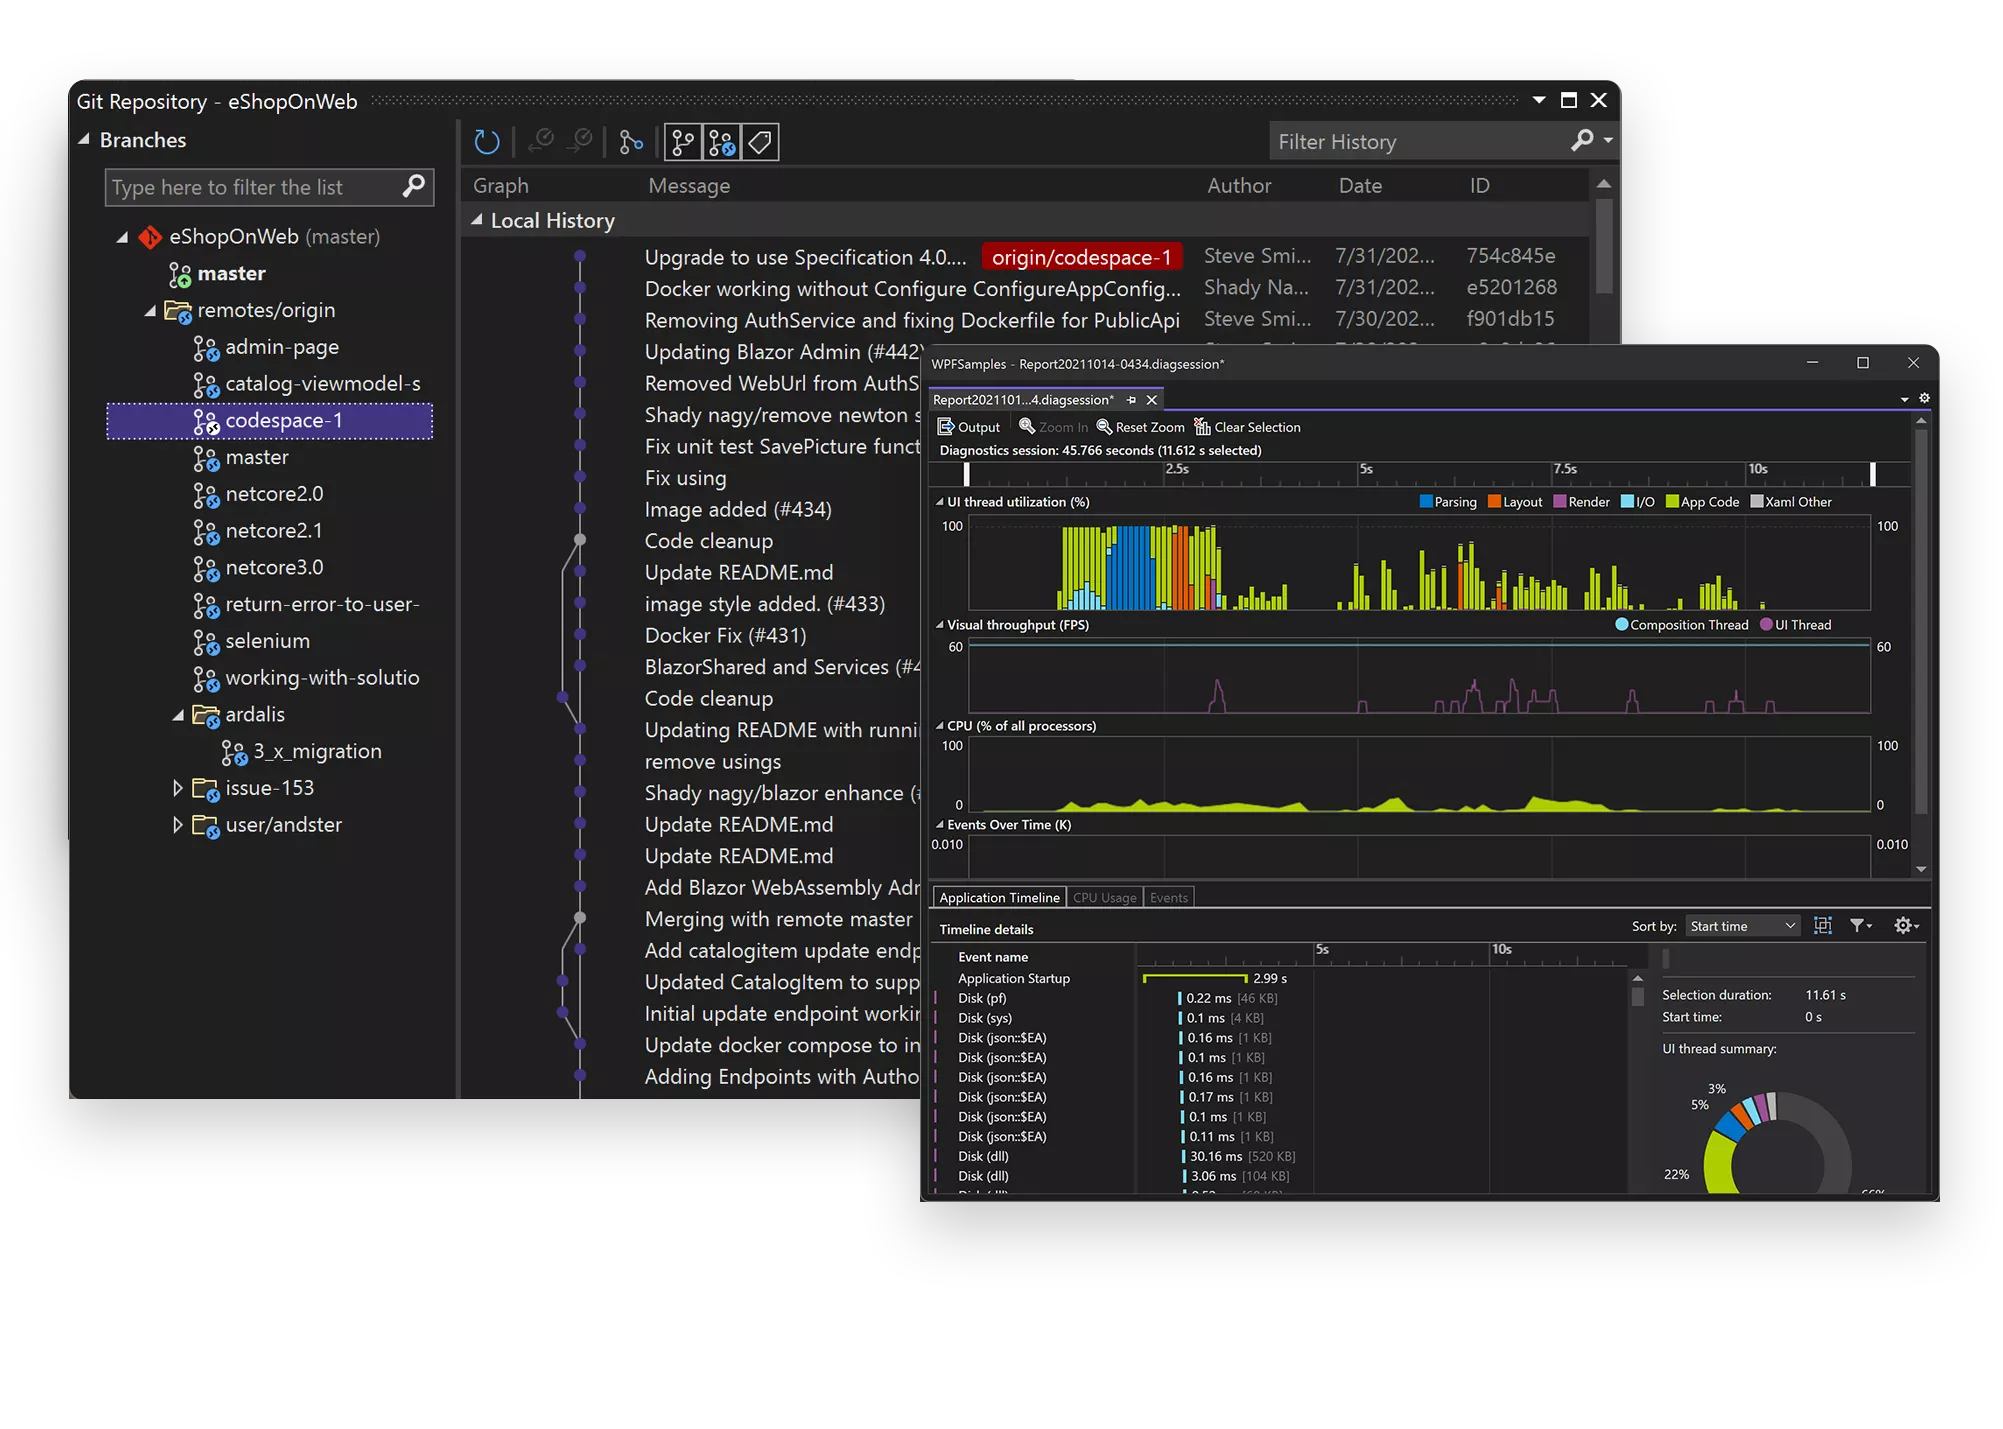
5. Analyzing Performance with Profiling
Performance can be a critical aspect of any Angular application. To identify performance bottlenecks and optimize your code, you can use profiling tools available in Visual Studio Code. These tools provide insights into the execution time of various components, functions, and network requests of your application.
The built-in profiling tools in Visual Studio Code allow you to record performance snapshots of your Angular application. These snapshots capture the stack trace and timing information for each function call and component rendering. By analyzing these snapshots, you can identify areas of your code that consume excessive resources or execute slowly.
Additionally, you can leverage third-party profiling tools like Chrome DevTools’ Performance tab or Angular’s built-in Angular DevTools to gain deeper insights into the performance characteristics of your Angular application. These tools provide features such as CPU profiling, memory profiling, and network analysis, allowing you to pinpoint performance bottlenecks and optimize your code for better user experience.
6. Debugging Angular Tests
In addition to debugging your Angular application code, you can also debug your unit tests to identify issues with your test suites or individual test cases. Debugging tests can help you understand why a particular test is failing and allow you to trace the execution of your test code to locate and fix bugs.
To debug Angular tests in Visual Studio Code, you can create a separate configuration in your launch.json file specifically for running tests. This configuration should specify the test runner (e.g., Karma or Jest), the test files or patterns, and any additional setup or environment variables required for testing. Once the configuration is set up, you can run and debug your tests using the debugger panel in Visual Studio Code.
Similar to debugging your application code, you can set breakpoints in your test code, step through the execution, and examine variables to understand the behavior of your tests. By identifying and fixing issues with your tests, you can ensure the reliability and accuracy of your Angular application’s test suite.
7. Utilizing Angular DevTools
Angular DevTools is a browser extension that provides additional debugging capabilities specifically for Angular applications. It integrates with Chrome DevTools and offers Angular-specific features and insights that can aid in debugging and troubleshooting your Angular projects.
With Angular DevTools, you can inspect the component tree of your Angular application, view the bindings and properties of each component, and monitor the change detection process. This can help you understand how data flows through your application and identify issues with component state or data binding.
In addition, Angular DevTools provides an Augury tab that visualizes the Angular application’s state, including the routing configuration, module hierarchy, and component lifecycle events. This can assist you in understanding the overall structure of your Angular application and diagnosing issues related to routing or component lifecycle management.
Additional Resources
For more details and in-depth tutorials on debugging Angular in Visual Studio Code, you can refer to the following resources:
- Visual Studio Code Debugging Documentation
- Angular Debugging Guide
- Angular Testing Guide
- Angular DevTools Chrome Extension
Conclusion
Debugging Angular applications in Visual Studio Code can significantly improve your development workflow and help you identify and resolve issues more efficiently. By utilizing the various debugging techniques and tools available, such as setting up debugging configuration, remote debugging with Chrome DevTools, logging and console output, breakpoints and watch expressions, performance profiling, debugging tests, and leveraging Angular DevTools, you can gain better insights into your application’s behavior and streamline your debugging process. These techniques empower you to build more robust and high-performing Angular applications.
Frequently Asked Questions
In this section, we will address common questions about debugging Angular in Visual Studio Code. Debugging is an essential part of the development process, and having a good understanding of how to debug Angular applications using Visual Studio Code can greatly enhance your productivity.
1. How can I set breakpoints in my Angular code using Visual Studio Code?
To set breakpoints in your Angular code using Visual Studio Code, you can simply click on the leftmost margin of the code editor next to the line where you want the breakpoint. A red dot will appear, indicating that the breakpoint has been set. When you run your Angular application in debug mode, execution will pause at the breakpoint, allowing you to inspect variables and analyze the code at that specific point in time.
Setting breakpoints strategically can help you identify and fix bugs more efficiently, as you can observe the state of your application at different stages of execution.
2. How do I start debugging my Angular application in Visual Studio Code?
To start debugging your Angular application in Visual Studio Code, you need to configure a debug configuration. In your project’s root directory, you will find a folder named “.vscode” which contains a “launch.json” file. Open this file and add a configuration for Angular debugging. Typically, this configuration involves specifying the “launch” command and providing the necessary parameters, such as the path to the Angular CLI configuration file and the command line arguments for running your application.
Once the debug configuration is set, you can launch the debugger by selecting the appropriate configuration from the Debug panel in Visual Studio Code and clicking on the “Start Debugging” button (or pressing F5). This will launch your Angular application in debug mode, and you can then interact with it, set breakpoints, and step through the code.
3. How can I inspect the value of a variable while debugging Angular in Visual Studio Code?
Inspecting the value of variables is an important part of debugging, as it allows you to understand how your code is behaving and identify any potential issues. When you hit a breakpoint in Visual Studio Code while debugging your Angular application, you can open the “Variables” section in the Debug panel to see a list of variables and their current values.
You can expand each variable to see its properties and nested values. Additionally, you can hover over a variable in your code editor to see its value in a tooltip. This can be particularly useful when you want to quickly check the value of a variable without opening the Debug panel.
4. How can I step through my Angular code while debugging in Visual Studio Code?
Stepping through your Angular code while debugging allows you to execute your code line by line and observe how the execution flow progresses. This can be helpful for understanding the sequence of events and identifying any unexpected behaviors that may arise.
In Visual Studio Code, you can use the buttons in the Debug panel to step through your code. The “Step Over” button (F10) allows you to execute the current line of code and move to the next line, while the “Step Into” button (F11) allows you to dive into function calls and navigate through the code in more detail. The “Step Out” button (Shift+F11) is used to quickly exit from the current function and move to the next line of the calling function.
5. Can I use the Angular DevTools extension while debugging in Visual Studio Code?
Yes, you can use the Angular DevTools extension while debugging your Angular applications in Visual Studio Code. The Angular DevTools extension provides a set of additional debugging tools specifically designed for Angular applications. It allows you to inspect the component tree, view the state of your application, and track changes to the component properties and the application’s state over time.
To use the Angular DevTools extension, you need to install it from the Visual Studio Code marketplace. Once installed, you can open the Angular DevTools panel in the Debug panel and use its features to gain deeper insights into your Angular application’s behavior during debugging.
6. How do I use the debug tool in Visual Studio?
To use the debug tool in Visual Studio, there are multiple ways to initiate the debugging process. You can either press the F5 key on your keyboard, click on the Debug Target button located in the Standard toolbar, click on the Start Debugging button in the Debug toolbar, or navigate to the Debug menu and choose Start Debugging. Once you have initiated the debugging process, the application will start running, and the debugger will automatically run to the specific line of code where you have set a breakpoint, allowing you to thoroughly analyze and troubleshoot any potential issues.
7. How do I run debug code in Visual Studio terminal?
To run debug code in the Visual Studio terminal, you can utilize the Integrated Terminal feature within the VS Code by pressing Ctrl+`. This option allows you to input any necessary information for your program. Another option is to use an external terminal to launch your program. Additionally, you can configure the user setting java.debug for a smoother debugging experience in Visual Studio Code.
8. How do I open the debug menu in Visual Studio?
To open the debug menu in Visual Studio, you can either press F5 to run the program in Debug mode or choose Debug > Start Debugging from the menu. Once the program is running, you can enter a string in the console window when prompted for a name and then press Enter. This will allow you to access the debug menu and utilize its various features and functionalities while debugging your program in Visual Studio.
9. How do I run a script in debug mode?
Running a script in debug mode is a useful technique for troubleshooting and understanding the inner workings of the script. By using the set -x command, the script enters the debugging mode where it outputs each line being executed along with the values of variables and command results. This detailed output provides valuable information that aids in identifying errors and gaining a deeper understanding of how the script operates. Debug mode offers a transparent view into the script’s execution, allowing developers to pinpoint issues and enhance their understanding of the code’s functionality.
Summary
Debugging Angular in Visual Studio Code can be tricky, but with the right tools and techniques, it becomes easier.
First, make sure you have the Angular Language Service extension installed. This will give you helpful features like auto-completion and error-checking.
Next, use the debugger in Visual Studio Code to set breakpoints and step through your code. You can also use the Angular CLI to generate sourcemaps for better debugging.
Remember to console.log your variables and check for any error messages in the console.
Finally, use the ng serve command to start your Angular application, and then attach the debugger in Visual Studio Code to start debugging.
With these tips, you’ll be able to debug your Angular projects like a pro!
Related Posts
What is Microsoft Visual Studio used for?

Is Microsoft Visual Studio for free?
Is Visual Studio C# only?
How To Run Angular Project In Visual Studio Code?

How To Add Space In Visual Studio Code?
